1. Introduction to Currency Pair Analysis

Currency pair analysis is essential in understanding forex dynamics. It helps determine the relative strength between currencies. Major pairs like EUR/USD are the most traded, while minor and exotic pairs offer unique volatility. Analyzing historical behavior, volume, and spread is vital. Traders often look for predictable reactions at key levels. Volume and news timing affect pair movement. Understanding correlations with commodities also adds an edge. This section is foundational for all forex strategies.
2. Understanding the Forex Market Structure
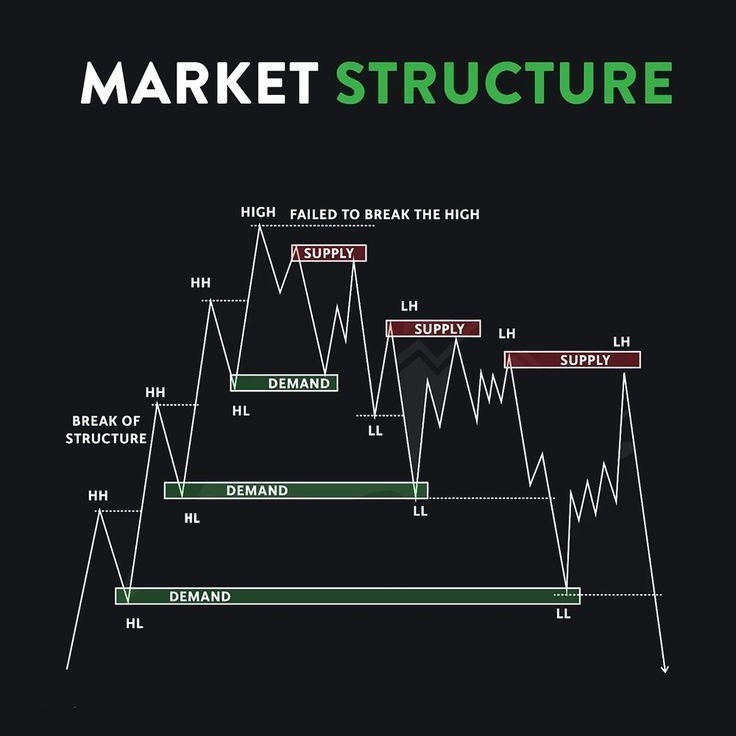
The forex market is structured around global sessions: Asian, London, and New York. These sessions bring different liquidity levels and trading behavior. The London session is the most volatile, while Asia is range-bound. Structure analysis includes swing highs/lows, liquidity zones, and fractal moves. Institutional moves often begin during London/NY overlap. Understanding internal vs external structure is key. Market cycles move through accumulation, manipulation, and distribution. Reading structure helps anticipate trend shifts and entries.
3. ICT Concepts Overview

ICT (Inner Circle Trader) concepts focus on institutional price delivery. Core ideas include Fair Value Gaps (FVG), Order Blocks, and Optimal Trade Entry (OTE). Market Maker Models explain how price moves from accumulation to distribution. Traders identify liquidity pools to predict manipulation. Key ICT tools are dealing ranges, Judas swings, and FVG imbalance fills. Entries are taken from OB or FVG in confluence zones. These strategies aim to trade with smart money flow, not retail patterns.
4. SMC (Smart Money Concepts) Overview
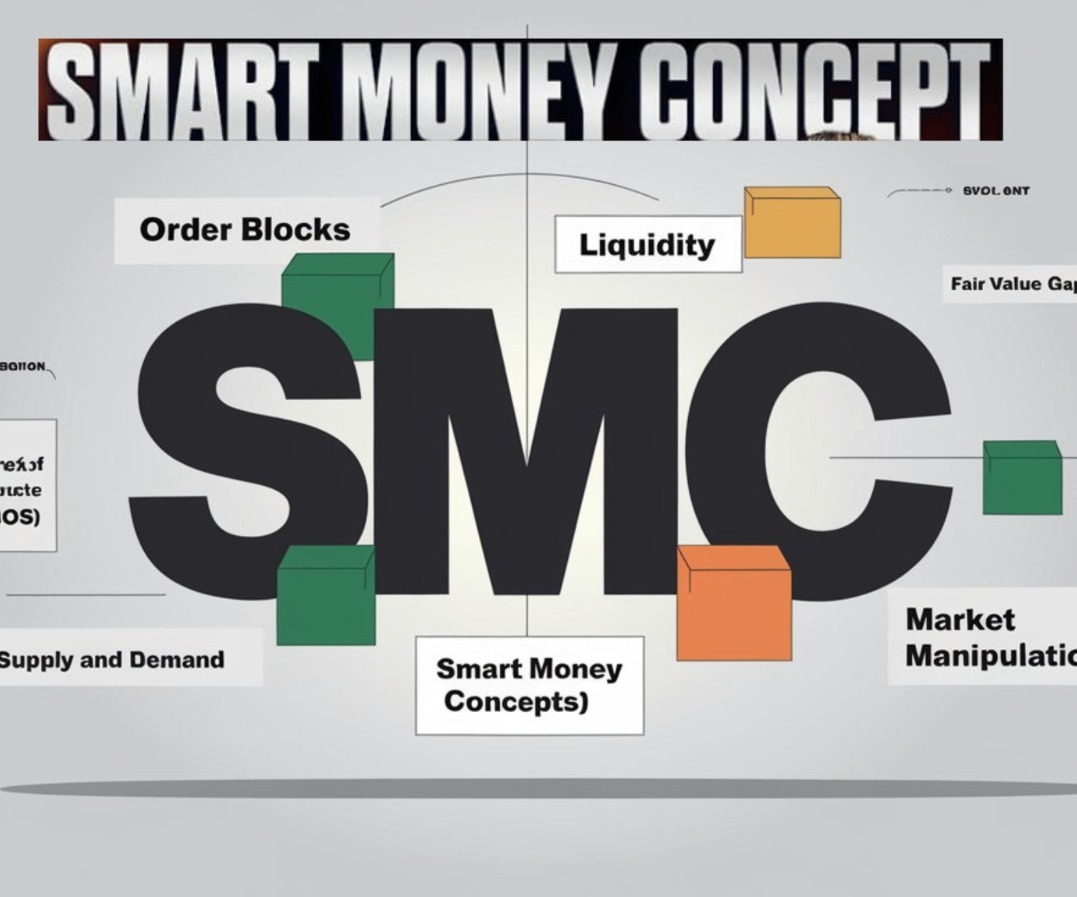
Smart Money Concepts (SMC) help traders align with institutional moves. BOS (Break of Structure) and CHOCH (Change of Character) are vital to trend shifts. Liquidity grabs show fakeouts before real direction. Premium and Discount zones guide entry placement. Order blocks represent zones of institutional intent. Inducement tricks retail traders into premature entries. Internal structure helps track trend development within a leg. Combining all these builds a framework for precision trading based on logic and flow.
5. Technical Analysis for Currency Pairs

Technical analysis supports traders in defining market direction. Trendlines show dynamic support/resistance. Fibonacci retracements highlight key pullback levels. Moving averages give dynamic trend bias. Chart patterns like flags and triangles offer breakout signals. Candlestick analysis helps spot rejections or breakouts. Support and resistance levels serve as entry or exit areas. Indicators like RSI or MACD offer confluence. When paired with SMC or ICT, technicals improve timing and confidence.
6. Fundamental Analysis Integration
Fundamentals influence long-term direction. Interest rate decisions by central banks affect currency strength. Economic indicators like inflation, GDP, and employment shift sentiment. High-impact news events create volatility spikes. Traders watch the economic calendar for forecasts and releases. Policy divergence between banks creates pair imbalances. Central bank tone (hawkish or dovish) signals future actions. Geo-political tensions also influence investor decisions. Integrating fundamentals gives traders context for technical setups.
7. Sentiment Analysis
Sentiment shows how traders feel about a pair. COT reports reveal institutional positions. Retail sentiment tools show herd behavior. Traders look for extreme sentiment to fade direction. Divergence between sentiment and price often leads to reversal. Fear or greed drives emotional decisions. Pairing sentiment with technical levels offers sharp entries. Volume data enhances sentiment understanding. News tone analysis also reveals bias shifts.
8. Multi-Timeframe Analysis (MTFA)
MTFA ensures alignment between trend and execution. Weekly and Daily charts define the bias. H4 and H1 are used for structure analysis. M15 and M5 give entry refinement. M1 offers sniper-level precision. Traders mark OBs, FVGs, and BOS across timeframes. Confluence of zones across frames strengthens setup. MTFA also filters out noise and avoids false entries.
9. ICT + SMC Case Study on EUR/USD
Example: EUR/USD forms CHOCH on H4, then BOS on H1. Price retraces into OB + FVG zone in premium range. Liquidity above Asia high gets swept. Entry taken at OB with tight SL and defined TP. Trade follows market maker model structure. Multiple timeframe confluence builds confidence. Case studies reinforce theory with real-world execution. Repeatable logic over random entries builds edge.
10. Common Mistakes in Pair Analysis
Traders often chase price and ignore structure. Misreading BOS or CHOCH leads to wrong bias. Ignoring liquidity results in fakeout losses. Overleveraging kills accounts fast. Disrespecting session timing reduces win rate. Confusion from indicators without clarity is common. Lack of journaling leads to repeated mistakes. Smart traders focus on edge, not emotions.
11. How to Build a Watchlist Like a Pro
Building a watchlist helps focus attention. Filter pairs by volatility, session timing, and clarity. Avoid overlapping trades with correlated pairs. Select pairs that fit your strategy type. Update list daily based on price action. Remove noisy or messy charts. Log behavior of each watchlisted pair. Use watchlist for trade planning, not prediction.
12. Risk Management in Currency Pair Trading
Risk management ensures long-term survival. Never risk more than 1% per trade. Use fixed or ATR-based stop losses. Reward to risk ratio must be at least 2:1. Take partials at key levels to lock profit. Don’t revenge trade after loss. Compound gains by preserving capital. Control emotions through strict rules.
13. Summary & Strategic Action Plan
Combine ICT and SMC for institutional-grade trading. Align HTF bias with LTF execution. Use OB, FVG, BOS, CHOCH in confluence. Track sentiment and structure. Avoid emotional trades or over-risking. Backtest every setup you plan to use. Create a repeatable process for entries. Download our guide and start refining your system.